In this blog post, we explore the performance of a Spring Boot 3.3.x application (CrudHtmx) deployed with various Docker configurations, including CDS (Class Data Sharing) and native images. This is a follow-up to our previous post on comparing no-build web applications with Spring Boot. We conducted tests to measure startup time, average response time, and request throughput using oha. Each configuration was tested twice with the second result recorded. The configurations were managed via Docker Compose with specified CPU and memory limits.
The source code for the application can be checked out from this GitHub repository https://github.com/dmakariev/examples.
git clone https://github.com/dmakariev/examples.git
cd examples/spring-boot/crud-htmx
Note that Jakarta Server Faces were excluded because they cannot be compiled to native images. Our goal is to optimize the application for the smallest existing instances offered by cloud providers.
Overview
Test Setup
For each Docker file and CPU/memory configuration, the following tests were executed:
- oha -z 30s http://localhost:8080/person-crud-htmx
- oha -z 30s http://localhost:8080/api/persons
The second result of each test was recorded to ensure consistency. The Docker Compose configurations were as follows:
- CPU: 1.0 cores, Memory: 512M
- CPU: 0.5 cores, Memory: 160M Here are the Dockerfiles used for the tests:
Dockerfile ( with spring-boot:process-aot)
FROM ghcr.io/bell-sw/liberica-openjdk-alpine-musl:22 as build
WORKDIR /workspace/app
COPY mvnw .
COPY .mvn .mvn
COPY pom.xml .
COPY src src
RUN --mount=type=cache,target=/root/.m2 ./mvnw clean compile spring-boot:process-aot package -DskipTests
RUN mkdir -p target/dependency && (cd target/dependency; jar -xf ../*.jar)
FROM ghcr.io/bell-sw/liberica-openjdk-alpine-musl:22
VOLUME /tmp
ARG DEPENDENCY=/workspace/app/target/dependency
COPY --from=build ${DEPENDENCY}/BOOT-INF/lib /app/lib
COPY --from=build ${DEPENDENCY}/META-INF /app/META-INF
COPY --from=build ${DEPENDENCY}/BOOT-INF/classes /app
ENTRYPOINT ["java", "-Dspring.aot.enabled=true", "-cp","app:app/lib/*","com.makariev.examples.spring.crudhtmx.CrudHtmxApplication"]
Dockerfile
FROM ghcr.io/bell-sw/liberica-openjdk-alpine-musl:22 as build
WORKDIR /workspace/app
COPY mvnw .
COPY .mvn .mvn
COPY pom.xml .
COPY src src
RUN --mount=type=cache,target=/root/.m2 ./mvnw clean package -DskipTests
RUN mkdir -p target/dependency && (cd target/dependency; jar -xf ../*.jar)
FROM ghcr.io/bell-sw/liberica-openjdk-alpine-musl:22
VOLUME /tmp
ARG DEPENDENCY=/workspace/app/target/dependency
COPY --from=build ${DEPENDENCY}/BOOT-INF/lib /app/lib
COPY --from=build ${DEPENDENCY}/META-INF /app/META-INF
COPY --from=build ${DEPENDENCY}/BOOT-INF/classes /app
ENTRYPOINT ["java", "-cp","app:app/lib/*","com.makariev.examples.spring.crudhtmx.CrudHtmxApplication"]
Dockerfile.cds
FROM ghcr.io/bell-sw/liberica-openjdk-alpine-musl:22-cds as build
WORKDIR /workspace/app
COPY mvnw .
COPY .mvn .mvn
COPY pom.xml .
COPY src src
RUN --mount=type=cache,target=/root/.m2 ./mvnw clean compile spring-boot:process-aot package -DskipTests
FROM ghcr.io/bell-sw/liberica-openjdk-alpine-musl:22-cds as optimizer
WORKDIR /workspace/app
COPY --from=build /workspace/app/target/*.jar application.jar
RUN java -Djarmode=tools -jar application.jar extract --destination application
WORKDIR /workspace/app/application
RUN java -Dspring.aot.enabled=true -XX:ArchiveClassesAtExit=application.jsa -Dspring.context.exit=onRefresh -jar application.jar
FROM ghcr.io/bell-sw/liberica-openjdk-alpine-musl:22-cds
VOLUME /tmp
ARG DEPENDENCY=/workspace/app
COPY --from=optimizer ${DEPENDENCY}/application /app/application
COPY --from=optimizer ${DEPENDENCY}/application/application.jsa /app/application.jsa
WORKDIR /app/application
ENTRYPOINT ["java", "-Dspring.aot.enabled=true", "-XX:SharedArchiveFile=application.jsa", "-jar", "application.jar"]
Dockerfile.cds (no spring-boot:process-aot)
FROM ghcr.io/bell-sw/liberica-openjdk-alpine-musl:22-cds as build
WORKDIR /workspace/app
COPY mvnw .
COPY .mvn .mvn
COPY pom.xml .
COPY src src
RUN --mount=type=cache,target=/root/.m2 ./mvnw clean compile package -DskipTests
FROM ghcr.io/bell-sw/liberica-openjdk-alpine-musl:22-cds as optimizer
WORKDIR /workspace/app
COPY --from=build /workspace/app/target/*.jar application.jar
RUN java -Djarmode=tools -jar application.jar extract --destination application
WORKDIR /workspace/app/application
RUN java -XX:ArchiveClassesAtExit=application.jsa -Dspring.context.exit=onRefresh -jar application.jar
FROM ghcr.io/bell-sw/liberica-openjdk-alpine-musl:22-cds
VOLUME /tmp
ARG DEPENDENCY=/workspace/app
COPY --from=optimizer ${DEPENDENCY}/application /app/application
COPY --from=optimizer ${DEPENDENCY}/application/application.jsa /app/application.jsa
WORKDIR /app/application
ENTRYPOINT ["java", "-XX:SharedArchiveFile=application.jsa", "-jar", "application.jar"]
Dockerfile.native
FROM ghcr.io/graalvm/native-image-community:22 as build
WORKDIR /workspace/app
COPY mvnw .
COPY .mvn .mvn
COPY pom.xml .
COPY src src
RUN --mount=type=cache,target=/root/.m2 ./mvnw clean package -DskipTests -Pnative,enhance native:compile
FROM ghcr.io/linuxcontainers/alpine:3.20
VOLUME /tmp
RUN apk add --no-cache libc6-compat
COPY --from=build /workspace/app/target/crud-htmx /app/crud-htmx
ENTRYPOINT ["/app/crud-htmx"]
Performance Metrics
The recorded metrics for each configuration are as follows:
| Configuration | Startup Time (secs) | Process Running Time (secs) | Person-crud-htmx Avg Time (secs) | Person-crud-htmx Requests/sec | API-persons Avg Time (secs) | API-persons Requests/sec |
|---|---|---|---|---|---|---|
| Dockerfile cpu:1.0 memory:512M | 6.493 | 6.899 | 0.1196 | 418.6827 | 0.1011 | 494.8035 |
| Dockerfile cpu:0.5 memory:160M | 22.898 | 23.814 | 1.0190 | 49.2932 | 0.6976 | 71.8548 |
| Dockerfile (with spring-boot:process-aot) cpu:1.0 memory:512M | 5.521 | 5.948 | 0.1243 | 401.5756 | 0.1088 | 459.7977 |
| Dockerfile (with spring-boot:process-aot) cpu:0.5 memory:160M | 18.091 | 19.039 | 1.0811 | 46.6612 | 0.7425 | 67.4869 |
| Dockerfile.cds cpu:1.0 memory:512M | 3.871 | 4.117 | 0.1355 | 369.0820 | 0.0983 | 509.7108 |
| Dockerfile.cds cpu:0.5 memory:160M | 13.582 | 14.107 | 0.8546 | 58.9894 | 0.4833 | 103.8122 |
| Dockerfile.cds (no spring-boot:process-aot) cpu:1.0 memory:512M | 4.592 | 4.877 | 0.1234 | 405.7420 | 0.1072 | 466.8502 |
| Dockerfile.cds (no spring-boot:process-aot) cpu:0.5 memory:160M | 15.919 | 16.36 | 0.7149 | 70.2904 | 0.6674 | 75.3208 |
| Dockerfile.native cpu:1.0 memory:512M | 0.3 | 0.303 | 0.0583 | 856.8795 | 0.0307 | 1629.4684 |
| Dockerfile.native cpu:0.5 memory:64M | 1.212 | 1.241 | 0.2530 | 197.5363 | 0.1786 | 279.9620 |
Graphical Representation
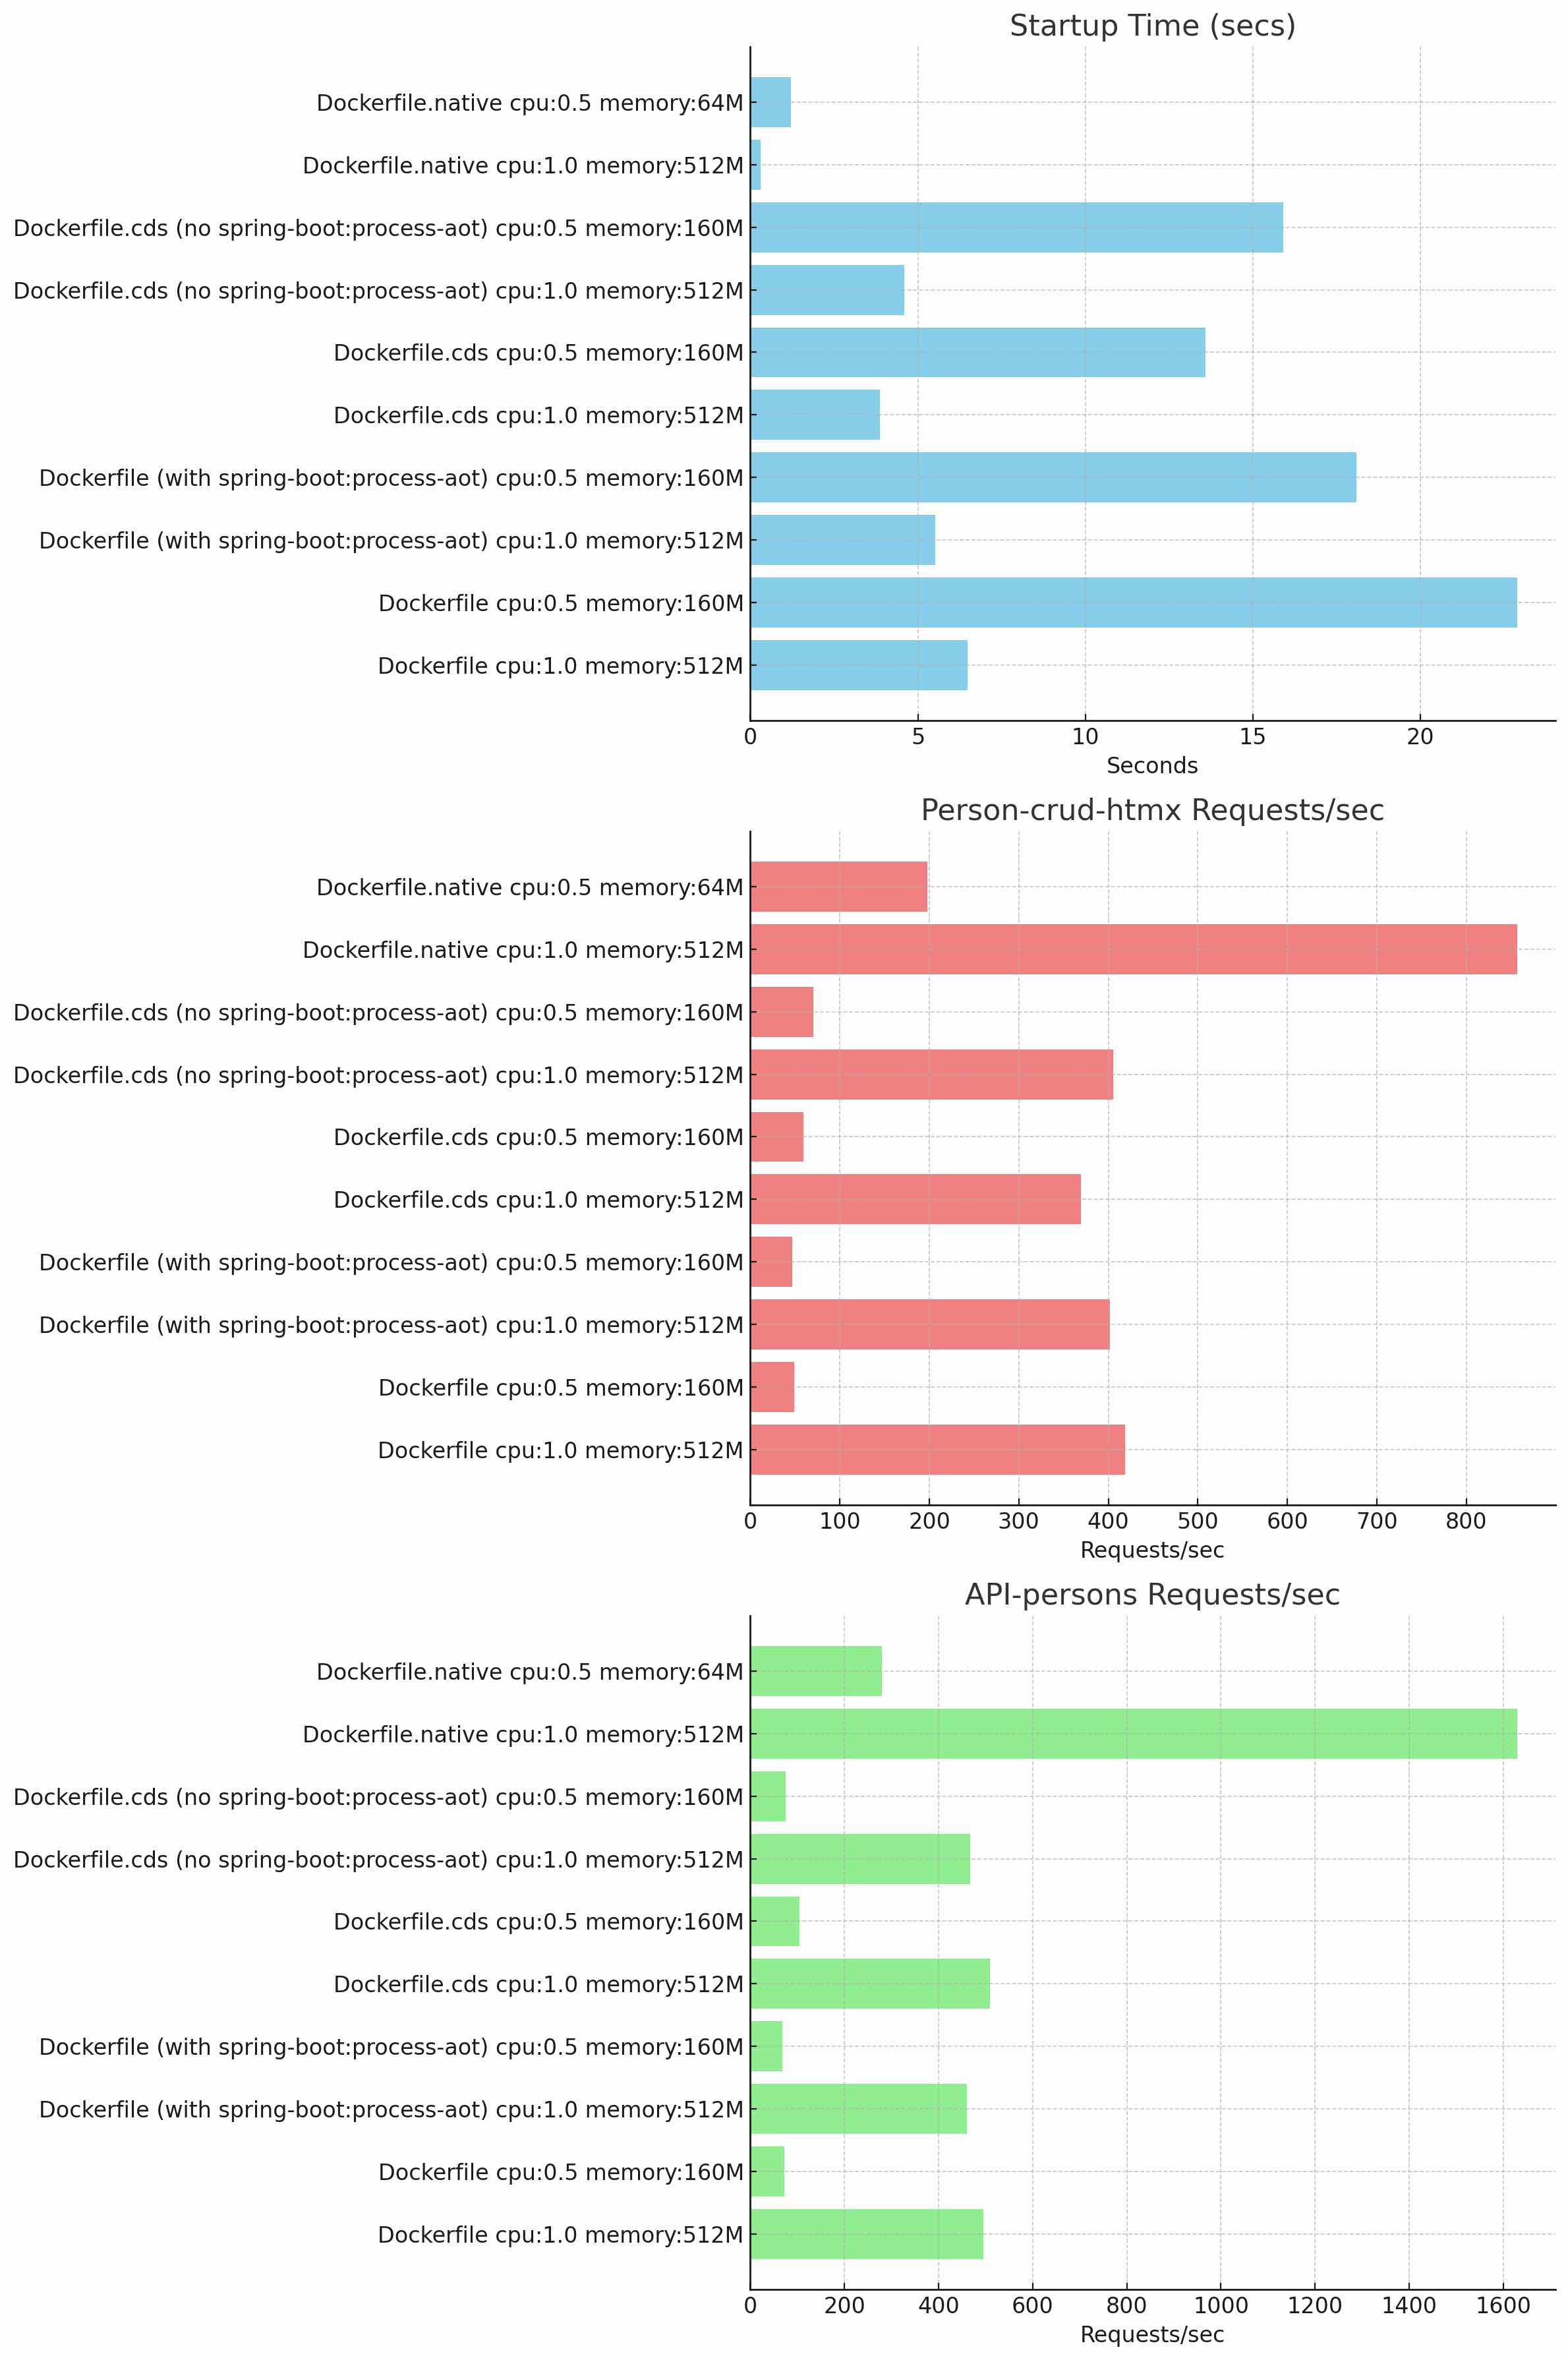
Below are the performance graphs that provide a visual comparison of the different Docker configurations for the Spring Boot 3.3.x application:
-
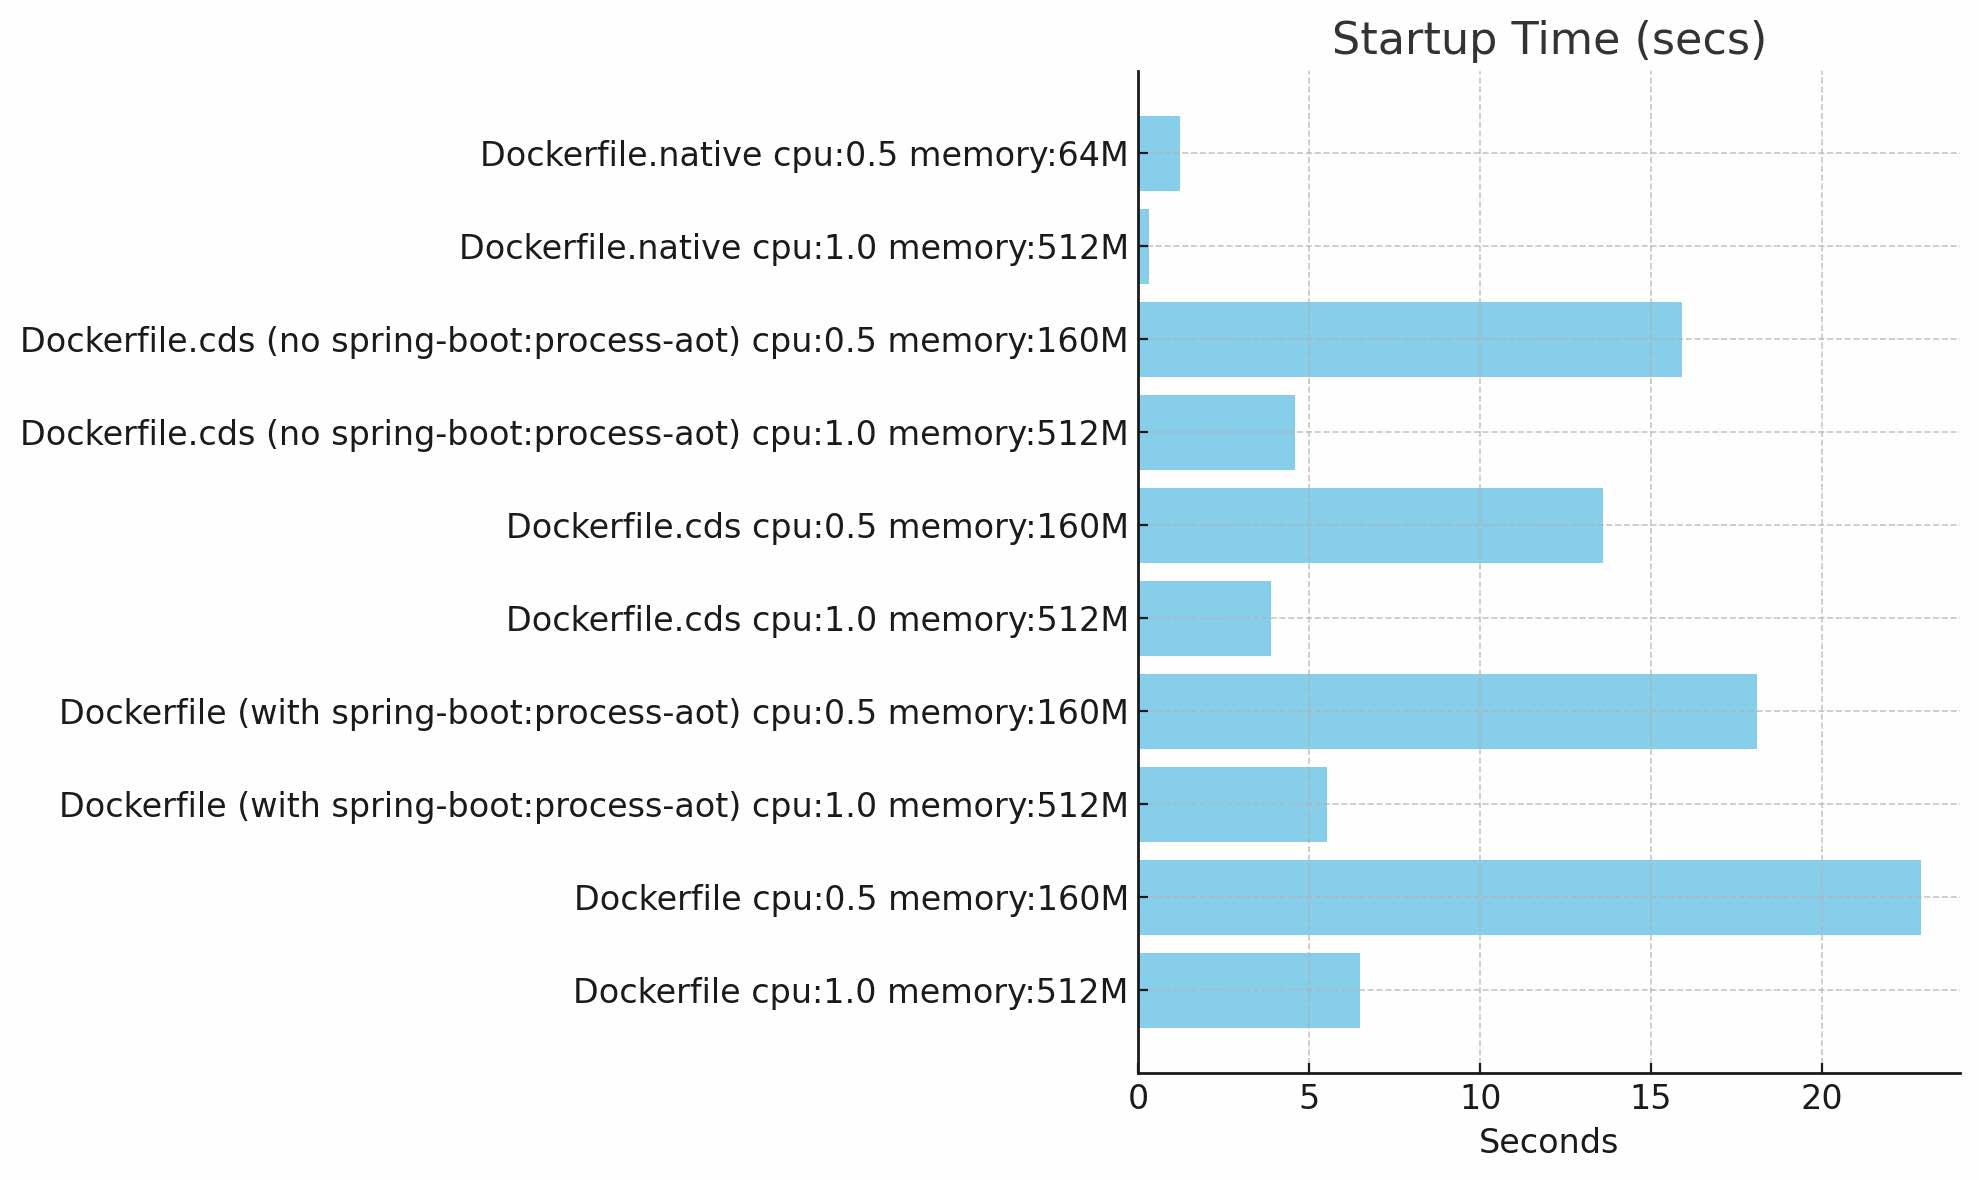
Startup Time (secs): This chart shows the time taken to start the application for each configuration.

-
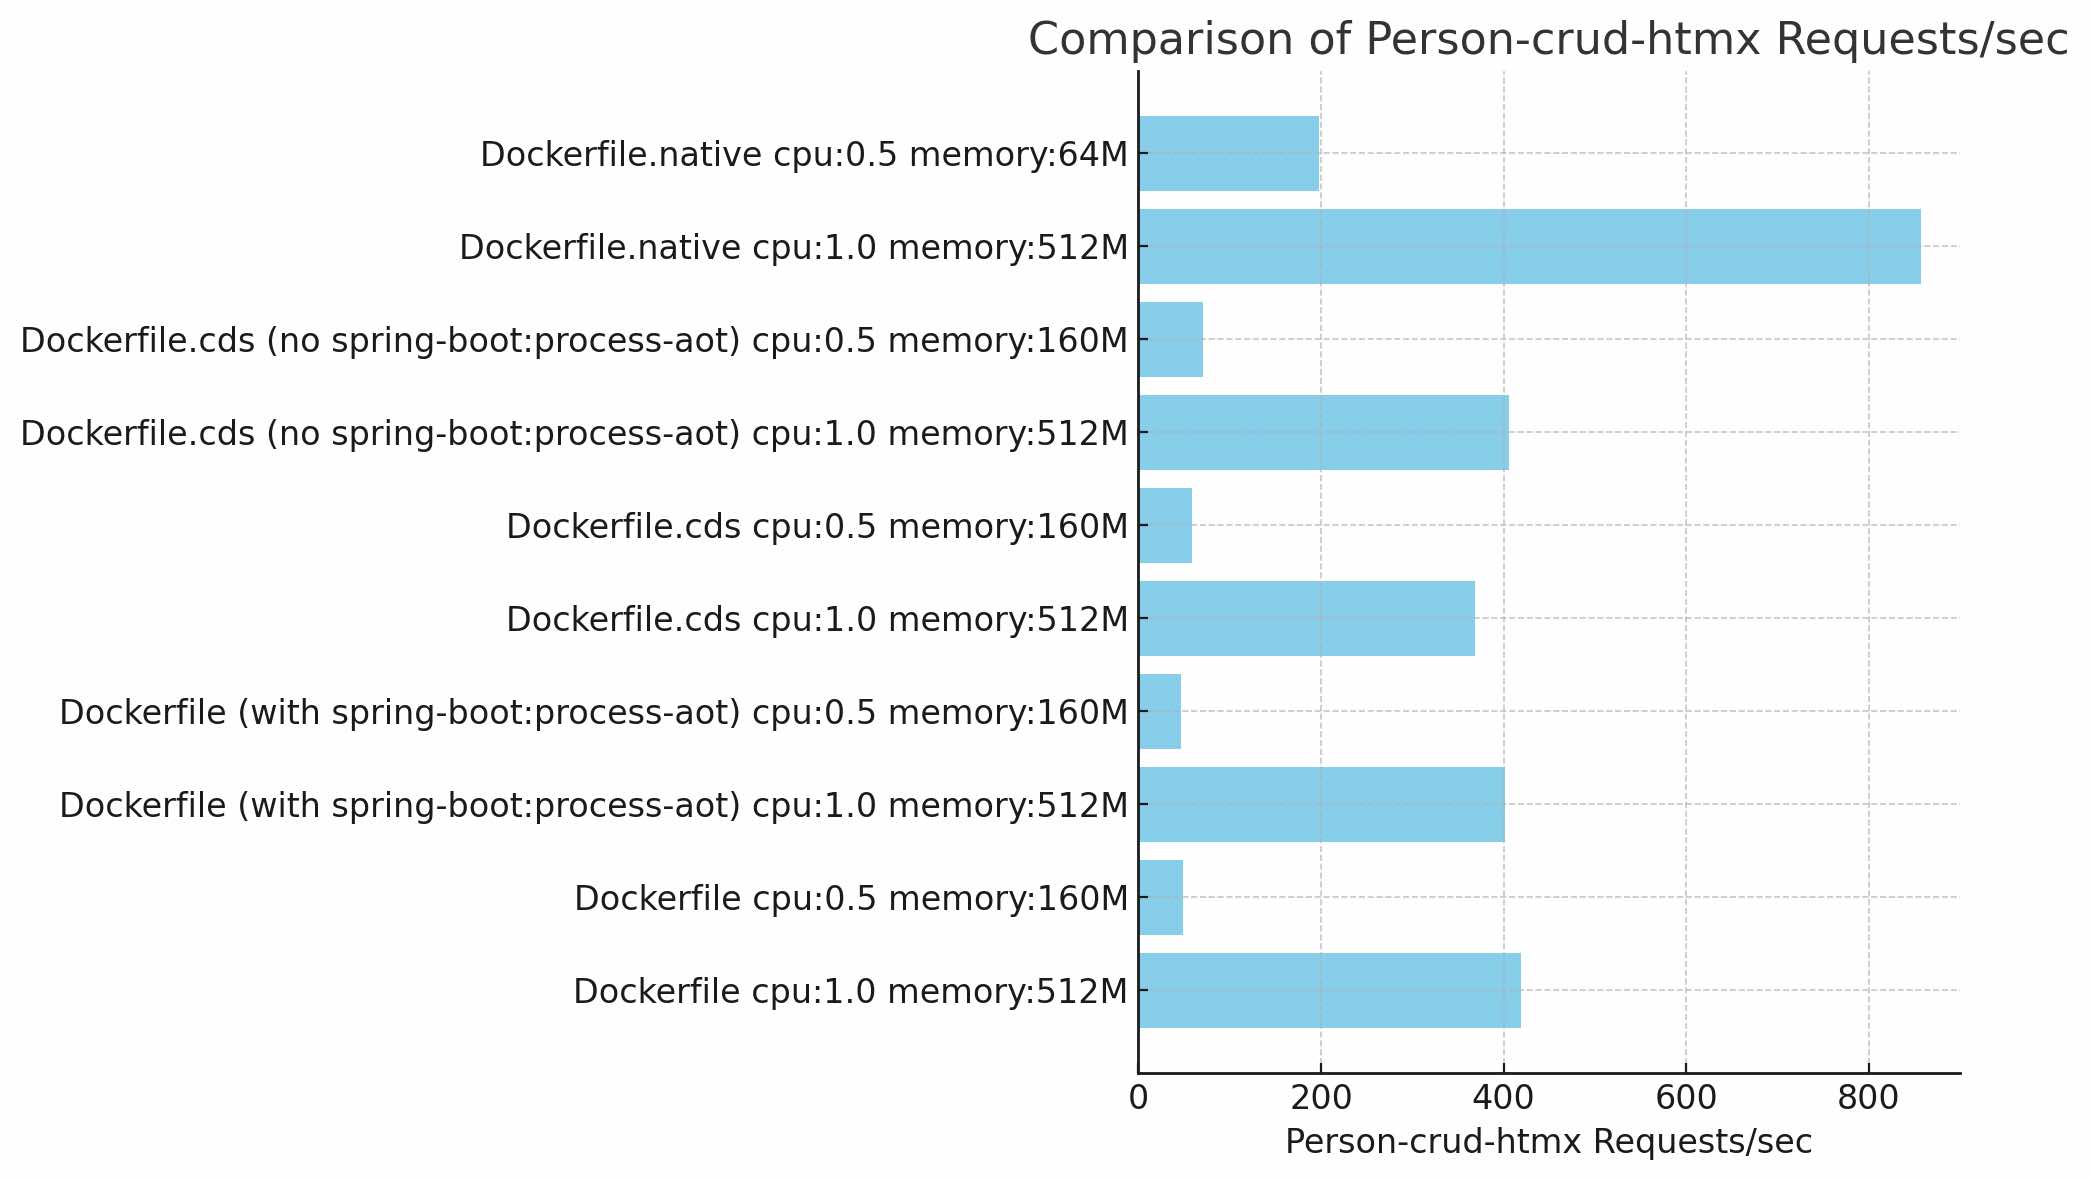
Person-crud-htmx Requests/sec: This chart displays the number of requests handled per second by the
/person-crud-htmxendpoint for each configuration.
-
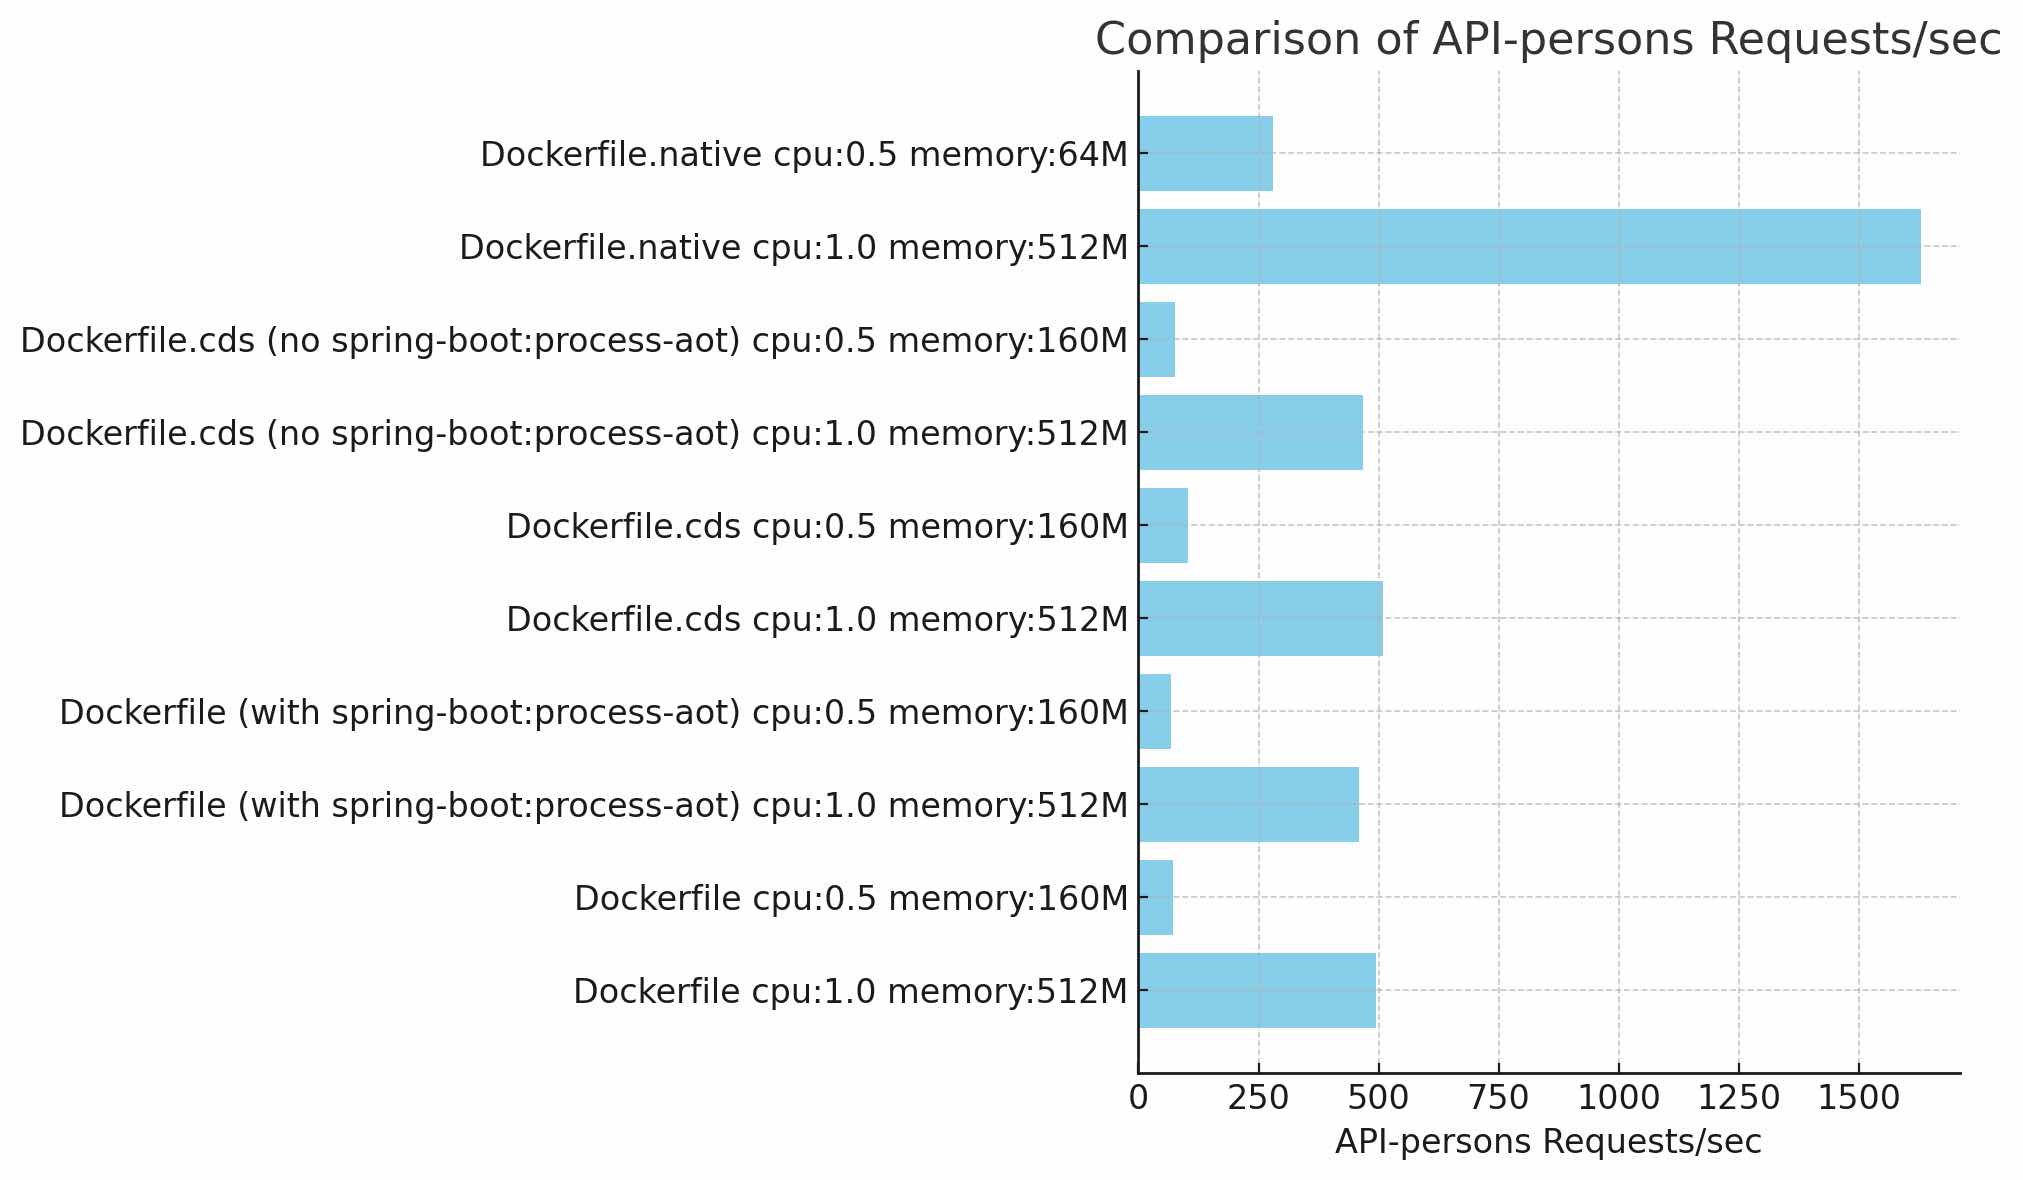
API-persons Requests/sec: This chart shows the number of requests handled per second by the
/api/personsendpoint for each configuration.
These graphs provide a comprehensive view of the performance metrics, allowing you to easily compare startup times and request handling capacities across different configurations.
Analysis
Based on the performance graphs and metrics provided, the configuration with the best overall performance is Dockerfile.native cpu:1.0 memory:512M. This configuration achieved the fastest startup time at 0.3 seconds, the highest requests per second for the /person-crud-htmx endpoint at 856.8795 requests per second, and the highest requests per second for the /api/persons endpoint at 1629.4684 requests per second.
However, it’s important to note that due to the nature of Just-In-Time (JIT) compilation, plain Java applications might achieve better throughput rates after a longer warm-up period. This is because JIT optimizes the code at runtime based on actual usage patterns, leading to highly optimized machine code. The trade-off, though, is that JIT-compiled applications typically consume more memory and have slower startup times compared to native images.
Updated based on a question
I’ve received the following question:
I wonder when the “might surpass” event really happens. Do you have an idea?
If you run the base configuration Dockerfile for 15 minutes with the command:
oha -z 15m http://localhost:8080/api/persons
the result is:
       Average: 0.0145 secs
  Requests/sec: 3436.4164
If you run the CDS configuration Dockerfile.cds with the same command -z 15m the result is :
       Average: 0.0147 secs
  Requests/sec: 3412.3965
In the blog post, after the second -z 30s, the result was:
      Average: 0.1011 secs
 Requests/sec: 494.8035
Result: After a 15-minute warmup, the base configuration is approximately 6.5 times faster than the configuration described in the blog post, while the CDS configuration has nearly the same performance as the base configuration.
Conclusion
In summary, while the native image configuration shows superior performance in both startup time and initial request handling, plain Java applications will surpass in throughput after extended operation, albeit with increased memory usage and longer startup delays.
If you are operating in a highly restricted environment with a requirement for down-to-zero, then it would be beneficial to prepare a native image. Otherwise, if you run for an extended period, using a build with CDS or just plain Java, there is virtually no difference.
Happy coding!
